High-performance MALDI-TOF Imaging Mass Spectrometry of Proteins and Peptides with Single-Cell Resolution and Sensitivity
Introduction
A new high-performance linear MALDI-TOF mass spectrometer is employed to image the spatial distribution of proteins in pancreatic tissue samples. This instrument employs a new ion optics system with a grounded ion source and efficient transfer and detection of ions over a broad mass range that provides very high sensitivity, precision, and dynamic range for both positive and negative ions. The instrument employs a solid-state Nd:YLF laser that provides 349 nm photons with fluence up to 30 mJ at 5kHz. The laser spot size is manually adjustable from 10 to 50 mm. A new 8 Bit high-speed Digitizer with an ADC sampling rate up to 2.5 GS/s on a single channel is employed. This digitizer features a PCI Express interface and optimized drivers that enable data transfer rates in excess 3.4GB/s. Software has been developed and validated that allow complete spectra to be acquired, stored and analyzed at rates greater than 300 spectra/s. This software makes it possible to process the raw spectral data “on the fly” to carry out processes including smoothing, baseline correction, peak detection, and recalibration without sacrificing speed, making it practical to save peaks and discard the raw data. As a result, the files are reduced in size by about an order of magnitude, and time required for producing images is also greatly reduced.
Method
The present work represents one of the first tests of this system. This work employed Zucker Diabetic Fatty (ZDF) rats 16-weeks old purchased from Charles River and included one diabetic, one obese and one lean rat for MS image acquisition. Three tissue segments from the pancreas of each rat were freeze mounted on ITO coated glass slides and analyzed using sinapinic acid matrix deposited by sublimation followed by rehydration to provide matrix crystals nominally 10 mm in size. Spectra were acquired and saved over the mass range 1400-20,000 Da at an effective acquisition rate of 300 pixels/s. Images of whole pancreatic tissue sections were generated at spatial resolution of 10 mm. The area of these sections ranged from 1 to 4 cm2. The time to produce an image at 10 mm spatial resolution was typically 1 hour/cm2. This work demonstrates the ability to detect and characterize single cells, and small clusters of cells by rapidly imaging whole tissue sections where the location of these cells of interest and chemical content may not be detected by classical staining and imaging.
Results
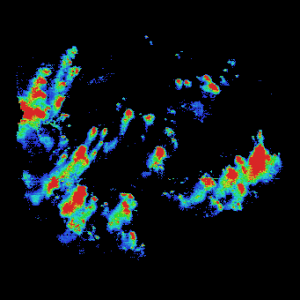
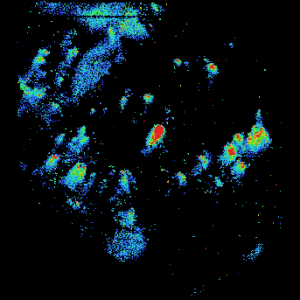
Total ion current images covering the range 2.5-20 kDa at 10 mm spatial resolution from all six tissue sections from the obese and lean rats are shown in Figure 1. These range in area from 1.2 to 2.2 cm2, and a total of 9.4 million spectra were acquired and analyzed in less than 10 hours. These images are dominated by insulin at m/z 5799 and glucagon at m/z 3484 corresponding to the beta and alpha cells of the Islets of Langerhans. The images shown were generated by setting a minimum intensity for the masses included, thus rejecting a low level matrix background at low mass and other proteins with low intensity distributed over the sample.
Obese Mouse

Lean Mouse

Figure 1. Obese and lean mouse, total ion current 2.5-20 kDa, 10 µm resolution, 9.4 million spectra total
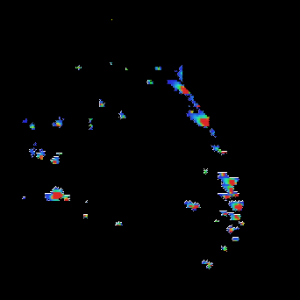
An example of an expanded view of the alpha cells producing glucagon in one islet of Langerhans is shown in Figure 2 for obese and lean rats. Similar views of beta cells (insulin) and alpha cells (glucagon) for all of the islets detected in all three rats may be generated by expanding the appropriate region of the image.
Obese Mouse Insulin

Lean Mouse Insulin

Obese Mouse Glucagon

Lean Mouse Glucagon

Figure 2. Insulin and Glucagon in obese and lean mouse
Conclusions
Lean rat islets are generally smaller and show some separation between insulin and glucagon. Obese rat islets tend to be larger in size and low level of glucagon is distributed over same areas as insulin. Very little glucagon was detected in diabetic rat. These results appear to corroborate with earlier observations that Male Zucker diabetic fatty (ZDF) rats develop obesity and insulin resistance at a young age, and then with aging, progressively develop hyperglycemia. The observation that the glucagon level is very low in the diabetic rat may be novel. More biological replicates will be performed to confirm these preliminary findings. Our study represents an exciting application of this novel MALDI MS imaging platform to single cell peptidomics and proteomics that may reveal new molecular insights into underlying mechanisms of metabolic diseases such as type 2 diabetes.

