Molecular Imaging of Biological Samples with Sub-cellular Spatial Resolution and High Sensitivity
Introduction
Imaging mass spectrometry is a mature technology that produces ion maps or images from the direct desorption of molecules from cells in tissues. Spatial resolutions of about 20 µm can be achieved routinely by standard commercial instruments. Recent work employing matrix deposition by sublimation and rehydration has produced protein images with 10 µm spatial resolution in favorable cases, such as the islets of Langerhans in the pancreas, but speed and sensitivity are inadequate for many practical applications. A new MALDI-TOF imaging system that provides very high acquisition rates, high spatial resolution, and efficient ionization and detection has recently been developed. Here we demonstrate high performance for imaging lipids at 20 µm spatial resolution using a laser beam with an effective diameter less than 5 µm. In this work, we sublimated DAN matrix using established protocols and found that spatial resolution in this case, at least down to 5 µm, is not limited by the size of the crystals.
Images of lipids in rat brain
Recent published work has shown that lipid profiles in brain showed a more complicated structure than other tissues examined, and negative ion images often provided more high-resolution detail than the positive ion images. This earlier work demonstrated the ability to obtain excellent images of rat and mouse brain sections with 20 µm spatial resolution at a rate of 20 pixels/s. Since we had already demonstrated higher speed and higher resolution on proteins in pancreas samples, this appeared to provide a more definitive test of our new MALDI-TOF imaging instrument. The samples were provided by Jeff Spraggins mounted on ITO glass slides with sublimated DAN matrix applied. The sample plates were shipped at “dry ice” temperature and were kept in dry ice until they were thawed and loaded into the instrument. Spectra were acquired and images generated for both positive and negative lipid ions; but the negative ion images showed substantially more detailed structure and the data summarized here is limited to negative ions.

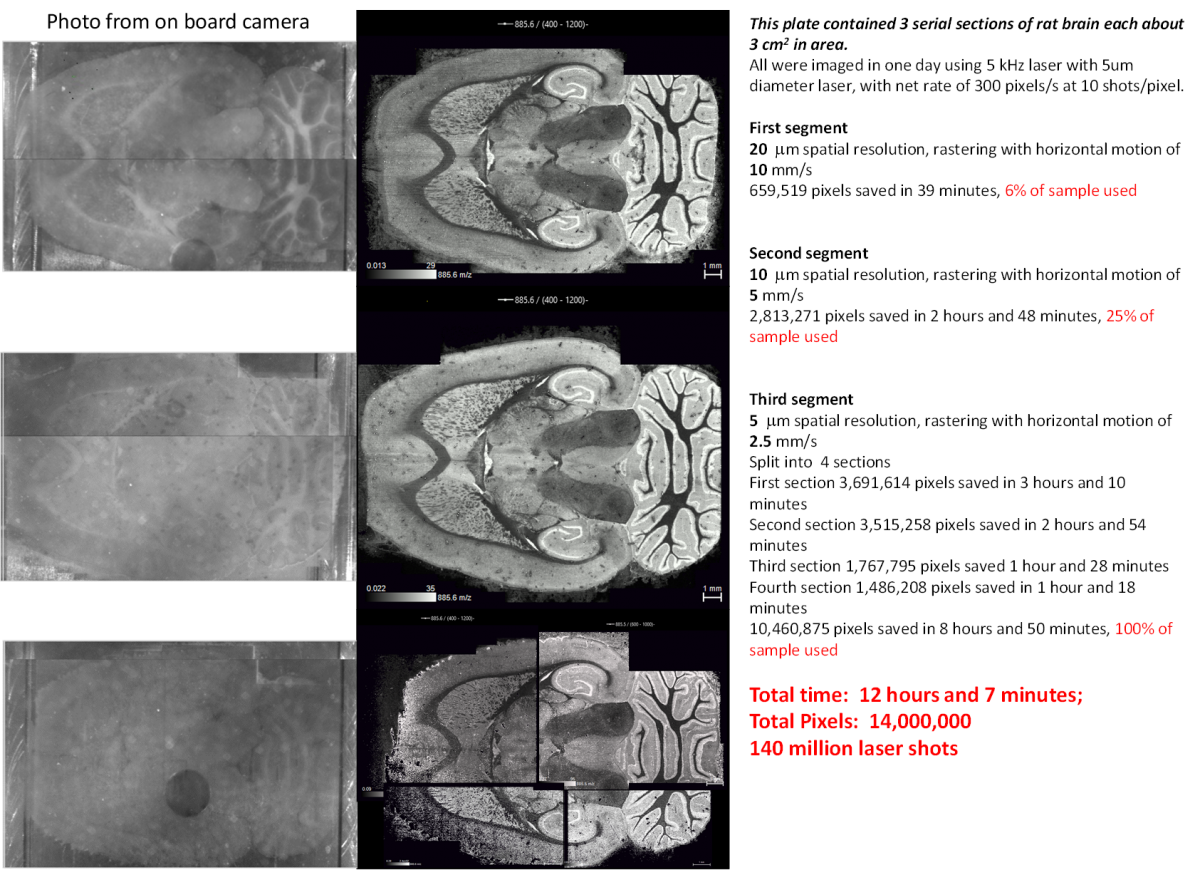
Figure 1. Negative ion Images of m/z 585.6 for three consecutive horizontal sections of mouse brain acquired at 20, 10, and 5 µm spatial resolution, respectively
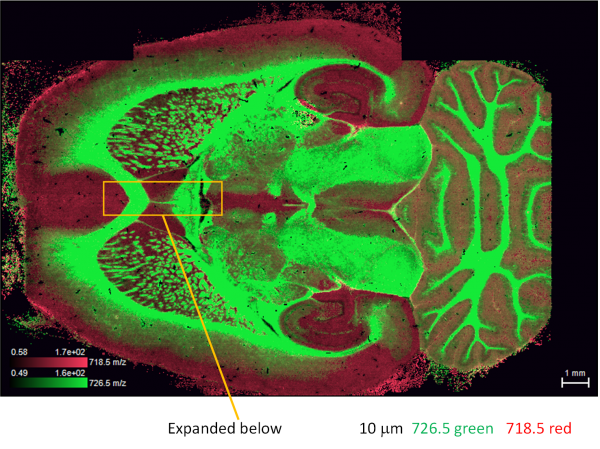
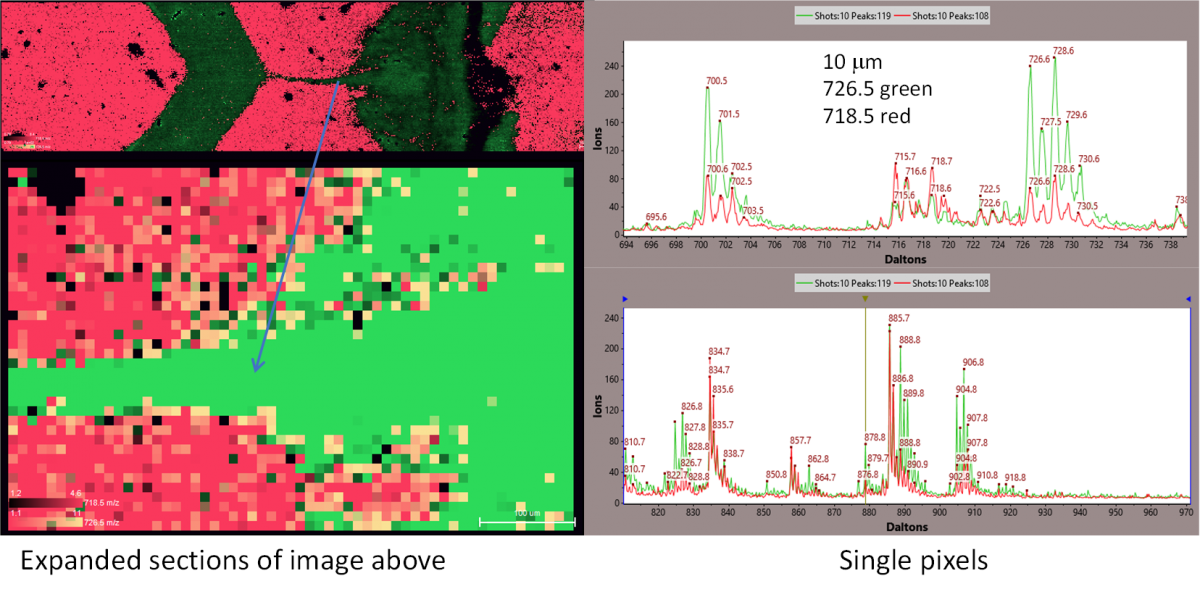
In most respects, the full images at 20 µm, 10 µm, and 5 µm spatial resolution are almost identical, but when expanded to show the distribution of single pixels, some small differences are found. For example, at 10 µm resolution, some pixels appear to correspond to single isolated cells. An example is illustrated in Figures 2 and 3. In the second expansion, you can see the individual 10 µm pixels. Spectra from single pixels from the red and green areas are shown here. The vertical scale on these spectra is the number of ions detected in each bin of the digitizer. The total number of ions per peak obtained by integrating over the peak is typically about 3 times the peak intensity for these spectra. The number of ions detected in each peak is the value used in generating the 2D images. While many masses are common to both red and green pixels, the relative intensities of most are substantially different.

Figure 2. The image for m/z 726.5 in green and 718.5 in red. 10 µm spatial Resolution, 5 kHz laser, 10 shots/pixel, 5 mm/s scan, 500 pixels/s acquired, 300 pixels/s saved, 3000 mass resolution, +/-0.1 Da mass accuracy. The region indicated in the yellow rectangle is expanded in Figure 3 below.

Figure 3. Expansions of the region indicated in the yellow rectangle in Figure 2

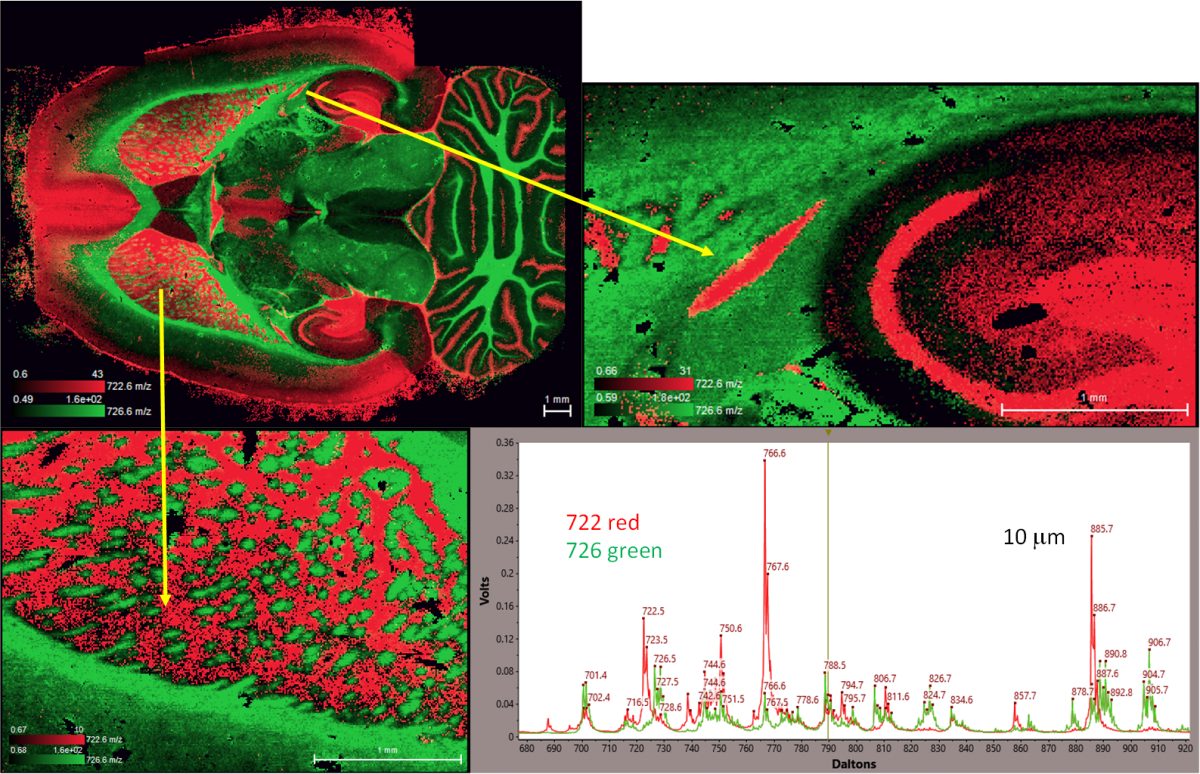
Figure 4. Superimposed images of m/z 722 and 726 with expansions of two selected regions together with spectra obtained by averaging over small regions of the red and green. It should be noted that these masses are relatively small part of the TIC.
Conclusions
The observation in Figure 1 that the quality of the images is independent of the spatial resolution shows that the number of lipid ions detected per pixel with the 5 µm dia laser beam is independent of the spatial resolution. For molecules present at lower concentrations the sensitivity may be enhanced by rastering the 5 mm beam at 5 µm intervals and summing the results over a larger area. In this case, there is a trade-off between speed and sensitivity according to the number of spectra summed/pixel. With the 5 mm laser beam the maximum time required to image a sample with area 1 cm2 is 4 hours, but there is the obvious trade-off between sensitivity and spatial resolution. The other advantage of employing a laser beam with a small diameter is that regions of interest can be found using a small fraction of the sample so that the rest can be used for higher spatial resolution or other analyses such as MS-MS.
In conclusion, the linear MALDI-TOF instrument excels in all 7S criteria (speed, specificity, spatial resolution, sensitivity, stability, simplicity and size) but specificity. High mass resolution MALDI-TOF and MS-MS instruments are required to provide elemental formula and structure of lipids imaged. Future work will focus on developing reflector MALDI-TOF and MS-MS systems that provide speed, spatial resolution, and sensitivity similar to that demonstrated here for the linear MALDI-TOF. The performance of this instrument shows that full 3D image of lipids is technically feasible with 10 mm spatial resolution for both positive and negative ions. Next step is to establish lipid signature for each cell detected in an image.
Acknowledgements
The authors are indebted to Katerina Djambazova, Jeff Spraggins, and Richard Caprioli from Vanderbilt University, not only for providing the samples used in this work, but also employing their extraordinary expertise in preparing the samples and applying the DAN matrix by sublimation.

