Imaging of Rat Brain Tissue Sections with SimulTOF TWO Linear MALDI-TOF
Rat brain tissue sectioned at 10 micron thickness and thaw mounted onto an ITO coated glass slide were imaged using 1,5-Diaminonaphthalene (DAN) matrix applied using sublimation.
In negative ions this segment was run at 200 pixels/s, 25 shots/pixel, scan speed 5 mm/s, laser rate 5 kHz, 6 uJ fluence for 25 um spatial resolution.
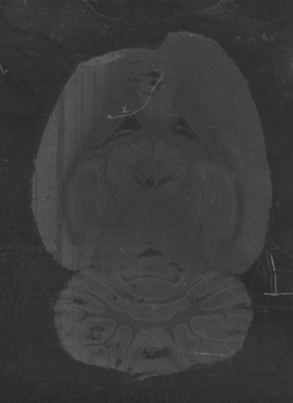
Figure 1. Photograph of rat brain tissue section
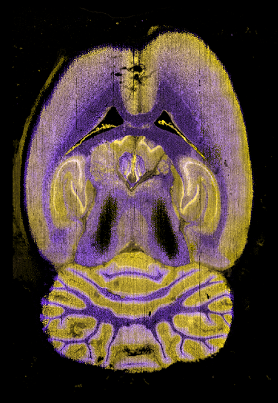
Figure 2. Ion intensity at m/z 885.557 and 888.632
The dynamic range between the base peak and the smallest detected peak was >1000.
Images for selected masses were generated using a bin width of ±0.4 Da.
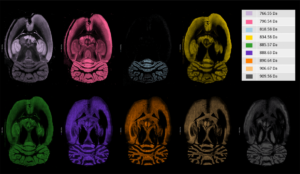
Figure 3. Results from SimulTOF TWO in Negative Ion Mode in Color
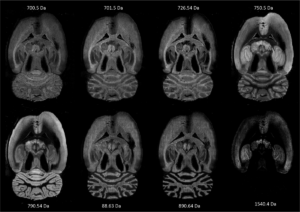
Figure 4.Results from SimulTOF TWO in Negative Ion Mode in Black and White
The mass range 300-2000 Da was recorded with 0.4 ns bin size. The number of spectra recorded was 480,000 for this segment 3 cm² in area, and the total time was about 45 minutes using 200 pixels/s. The effective laser diameter for all of these measurements was less than 10 um.
The mass spectra correspond to single pixels from areas where m/z 885.557 and 888.632 are the most intense peaks.
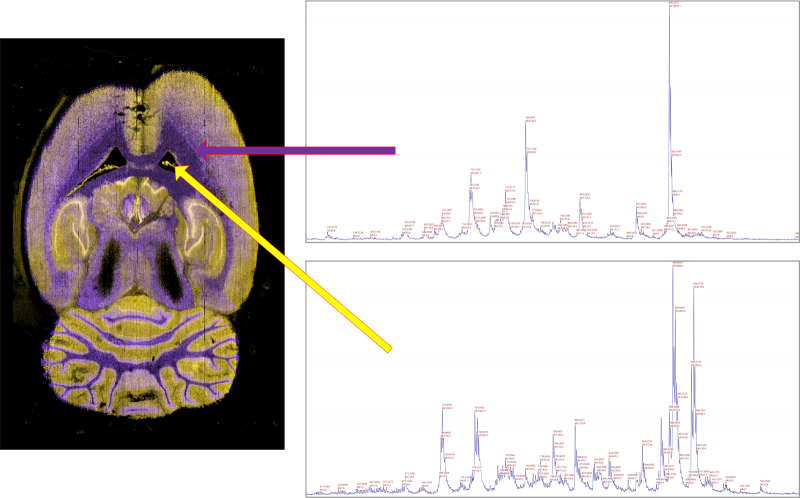
Figure 5. Examples of Single Pixel Spectra at m/z 888.683 (purple) and m/z 885.336 (yellow)

